
Community, Diversity, Sustainability and other Overused Words


Community, Diversity, Sustainability and other Overused Words
Computer scientist points to possible "undergrad mistake" in vote-generation code as results cluster tightly; officials and data show pattern consistent with state's Democratic dominance
Steve Hilton speaking to a crowd at the Palisades Bowl trailer park, which burned down on Jan. 7 2025. Hilton campaigned hard every day, while winner Javier Becerra mostly stayed home drinking beer. Becerra beat Hilton 2 to 1.
Computer scientist points to possible "undergrad mistake" in vote-generation code as results cluster tightly; officials and data show pattern consistent with state's Democratic dominance
Computer scientist points to possible "undergrad mistake" in vote-generation code as results cluster tightly; officials and data show pattern consistent with state's Democratic dominance
Did California Democrats cheat to win the election in California? I mean, not that they have to. But the math isn't mathing.
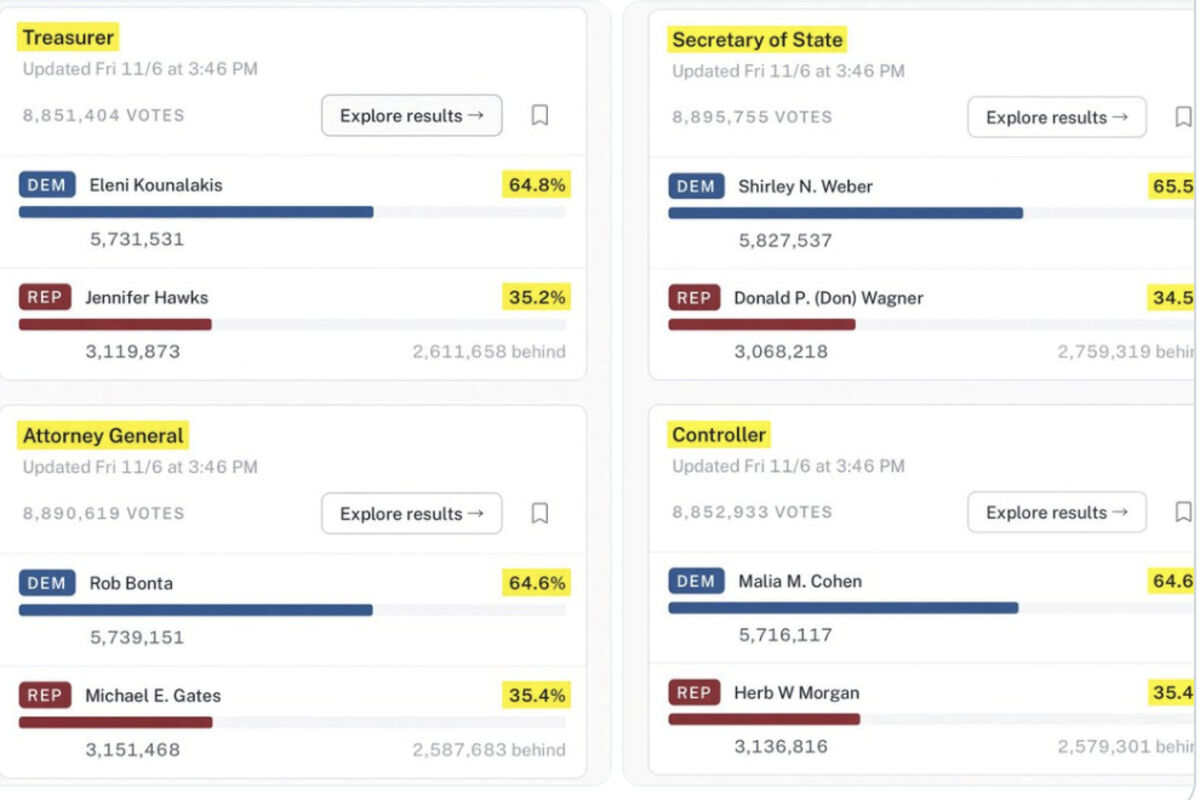
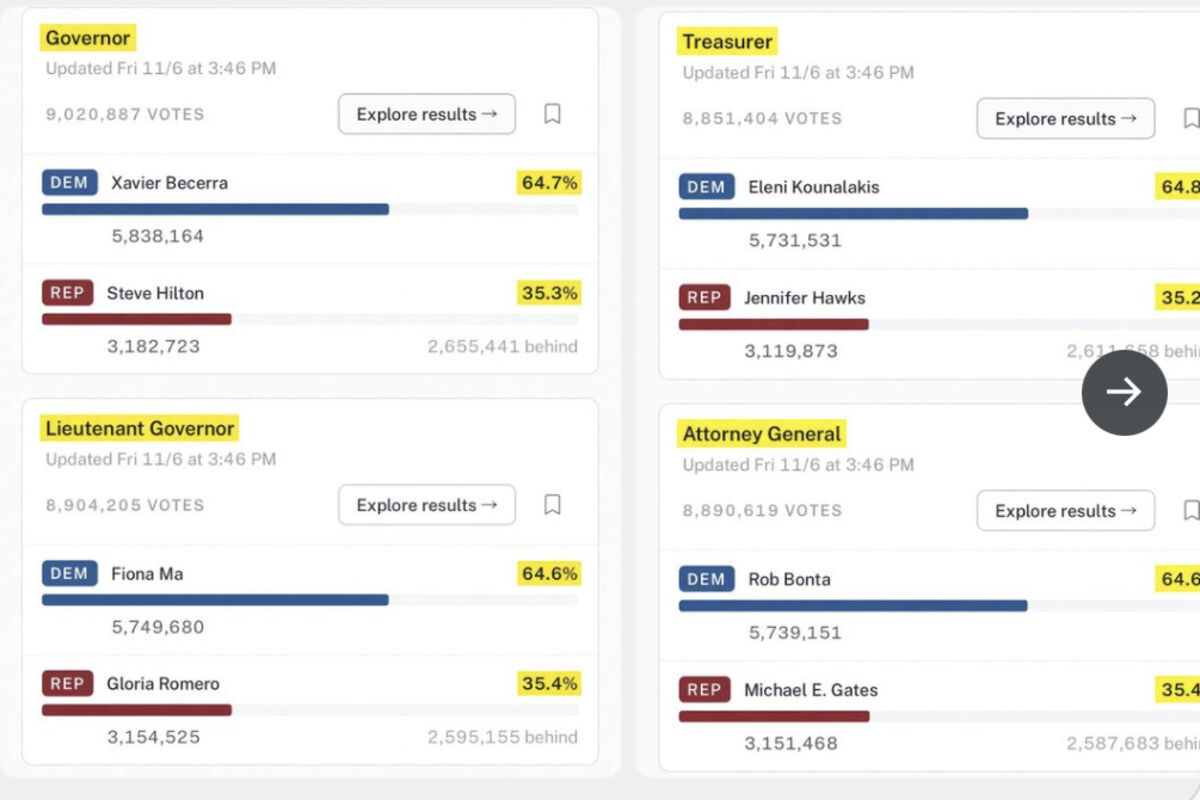
In the days after California's November 3, 2026, social media posts about the general election highlighted unusually consistent margins across major statewide races pitting Democrats against Republicans. Screenshots circulating widely showed candidates for governor, lieutenant governor, secretary of state, controller, treasurer, and attorney general all receiving roughly 64–66% for the Democrat and 34–35% for the Republican, prompting claims that the figures "don't look like real election results" and instead resemble the output of a computer algorithm.
A computer scientist posting as @nighttimemedia amplified the discussion, noting that the numbers were not simply rounded to 64/35 but clustered tightly around 64.6% ± 0.2 for Democrats and 35.4% ± 0.2 for Republicans in the early-to-mid counts that first drew attention. He described this as the kind of convergence that can result from a poorly implemented randomizing factor in software-an "undergrad mistake"-in which an intended random element fails to produce natural variation over large numbers of ballots and instead stabilizes near fixed ratios. He added that such manipulation typically leaves detectable statistical footprints that specialists in election data analysis would be expected to identify.
Official tallies from the California Secretary of State, still unofficial as of November 7–8 with roughly 70–75% of votes reported, place the results in a narrow but not identical band:
Governor: Xavier Becerra (D) approximately 65.3–65.5% versus Steve Hilton (R) 34.5–34.7%
Lieutenant Governor: Fiona Ma (D) 65.3% versus Gloria Romero (R) 34.7%
Secretary of State: Shirley Weber (D) 66.2–66.3% versus Donald Wagner (R) 33.7–33.8%
Controller: Malia Cohen (D) 65.3% versus Herb Morgan (R) 34.7%
Treasurer: Eleni Kounalakis (D) 65.5% versus Jennifer Hawks (R) 34.5%
Attorney General: Rob Bonta (D) 65.3% versus Michael Gates (R) 34.7%
Two California Supreme Court retention elections ran higher, at roughly 71–72% "Yes." Not every contest followed the same pattern; the Insurance Commissioner race, a Democrat-versus-Democrat contest, sat near 53/47.
California's voter registration data provides the clearest demographic context. The final 15-day report before the election showed Democrats comprising about 45% of registered voters (roughly 10.5 million), Republicans about 24.7% (roughly 5.7 million), and No Party Preference voters about 23%. Democrats outnumber Republicans nearly two-to-one among partisans. In low-information statewide offices, voters in such an environment tend to vote heavily along party lines, with independents leaning Democratic on average in general elections. This produces consistent two-party margins across similar races.
Comparable clustering has appeared in prior cycles. In 2018, several statewide Democratic candidates landed between roughly 62% and 65.5%. In 2022, most major offices settled near 59–60% Democratic, with more variation when stronger Republican candidates ran. Judicial retention votes commonly exceed 70% "Yes" when organized opposition is limited.
County-level administration, paper ballots, chain-of-custody requirements, and post-election audits remain the framework for California's elections. Results will continue to update as remaining vote-by-mail and provisional ballots are processed, with final certification due by December 11. While the tight early clustering fueled online speculation about software behavior, the broader pattern aligns with the state's longstanding partisan registration advantage and historical voting behavior in comparable contests. The debate, driven largely by social media posts, continues as the canvass proceeds.




Reader Comments(0)